Overview
A disk image tells you what was stored on a machine. A memory image tells you what the machine was doing: which processes were running, which files they had open, what someone typed into a console, which URLs a browser had loaded, and which secrets were sitting in environment variables. A lot of that never reaches the disk, so RAM is often the only place to find it.
Volatility is the standard open-source framework for this work. It reads a raw memory image, rebuilds the operating system’s kernel data structures, and gives you plugins that answer specific questions, such as “list the processes” or “show me the console history”. This post is a reference guide to the workflow I follow on Windows memory dumps. I explain each plugin and what its output means, then work through three challenges from the DD CTF run by team bi0s:
- recoverytxt: browser history points at two files, which I recover from memory and decode.
- blackscreen execution: the answer sits in console command history.
- the analyst: a password-protected zip recovered from memory, an environment variable holding a cipher key, and a Chrome process whose memory contains a pastebin link.
I don’t cover the challenges one at a time. Each one appears at the step of the workflow where it gets solved.
Scope and ethics. These were educational memory images from a CTF that has since concluded. All analysis was done locally on dumps the organisers distributed for that purpose. Flags are redacted as
bi0s{...}in the text and blacked out in the screenshots.
Volatility in brief
All three dumps are Windows 7 SP1, 32-bit images, and I analysed them with Volatility 2.6.1, which runs on Python 2. Volatility 2 has to be told which OS build produced the dump. It does this through a profile, a name like WinXPSP2x86, Win7SP1x86, or Win7SP1x64 that bundles the structure layouts (offsets of fields inside _EPROCESS, _FILE_OBJECT, and so on) for that build. If the profile is wrong, plugins misread memory and return garbage or nothing at all. Volatility 3 drops profiles in favour of downloadable symbol tables, but the plugin concepts below carry over almost one-to-one.
Every command has the same shape:
python2 vol.py -f <image> --profile=<Profile> <plugin> [options]
A note on import errors
When Volatility starts, you will probably see a wall of messages like this:

These errors mean the plugin modules that import Crypto.Hash could not be loaded. They are not just cosmetic. In my first runs, envars was one of the plugins that failed to load. The fix is to install a crypto library that provides the Crypto namespace for Python 2, for example:
pip2 install pycryptodome distorm3
A similar error about libyara only affects the YARA-scanning plugins and is safe to ignore if you don’t need them.
Step 1: identify the profile with imageinfo
Always run imageinfo first. Every other plugin depends on the profile, and imageinfo is how you find it.
python2 vol.py -f chall.raw imageinfo

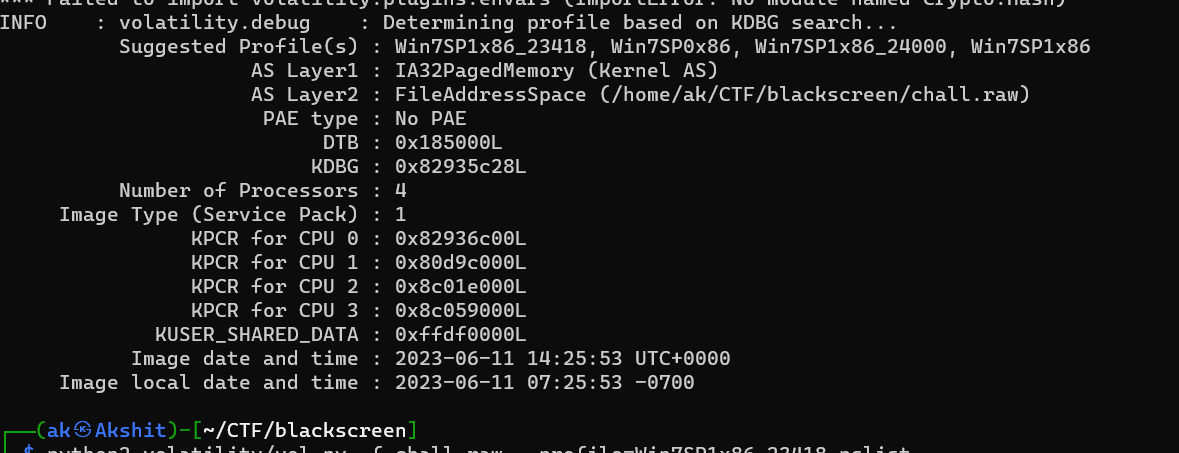
imageinfo scans the image for the kernel debugger data block (KDBG), a structure Windows keeps for debuggers that points to the process list, the loaded-module list, and other key kernel structures. Its contents and location identify the OS build. Here is the output for the blackscreen image:

How to read it:
- Suggested Profile(s): candidates in order of likelihood.
Win7SP1x86_23418andWin7SP1x86_24000are profiles for specific Windows 7 SP1 kernel builds;Win7SP1x86is the generic SP1 profile. All of them point to 32-bit Windows 7. - AS Layer1: IA32PagedMemory and PAE type: No PAE: Volatility will translate virtual addresses using 32-bit, non-PAE paging. This is the address space every plugin uses.
- DTB: the Directory Table Base, the physical address of the kernel’s page directory (the value in the
CR3register). Volatility needs it to translate kernel virtual addresses. - KDBG and KPCR for CPU 0-3: the debugger block and one processor control region per CPU. Four KPCRs is consistent with “Number of Processors: 4”.
- Image Type (Service Pack): 1: confirms SP1.
- Image date and time: when the dump was taken (2023-06-11 14:25:53 UTC, or 07:25:53 at UTC-7 local time). This anchors every other timestamp you will see.
For blackscreen I used the first suggestion, Win7SP1x86_23418. The other two images gave the same picture. Here is the one for “the analyst” (ch4ll.raw):
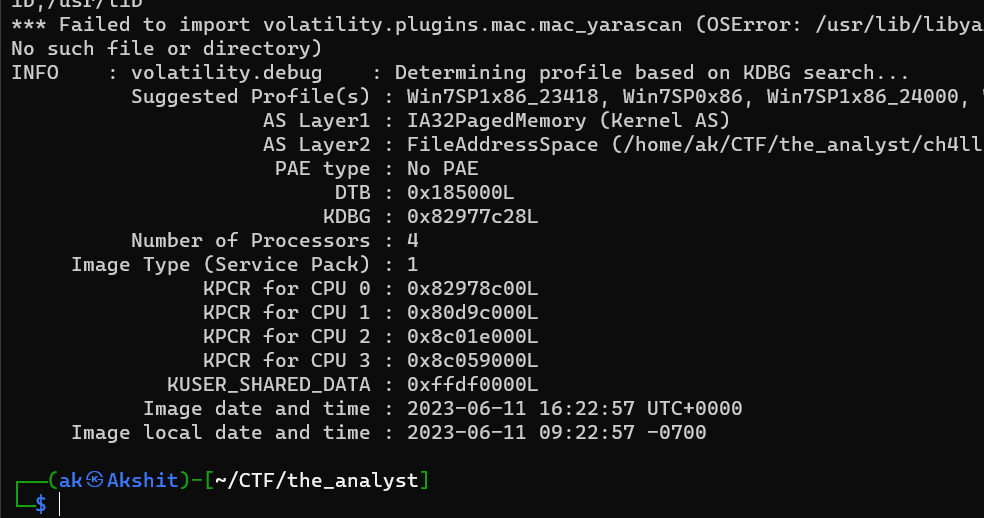
For that image and for recoverytxt, the generic Win7SP1x86 profile worked fine. If two suggested profiles give conflicting results, the kdbgscan plugin shows each KDBG candidate in detail, including how many processes and modules it finds. The candidate with sensible non-zero counts is the right one.
Step 2: map the processes
With the profile set, the next question is what was running. There are four process plugins, and the differences between them matter:
python2 vol.py -f ch4ll.raw --profile=Win7SP1x86 pslist
python2 vol.py -f ch4ll.raw --profile=Win7SP1x86 pstree
python2 vol.py -f ch4ll.raw --profile=Win7SP1x86 psscan
python2 vol.py -f ch4ll.raw --profile=Win7SP1x86 psxview
pslistwalks the kernel’s doubly linked list of active_EPROCESSstructures, which is the same list Task Manager uses. It is fast and accurate for normal processes, but it misses anything unlinked from the list, such as processes hidden by a rootkit or processes that have already exited.pstreeshows the same data aspslistbut indents each child under its parent. That makes odd parent-child relationships obvious, such ascmd.exespawned by a document viewer.psscanignores the list completely. It scans physical memory for the pool tag that marks_EPROCESSallocations, so it also finds terminated processes (with an exit time) and unlinked ones.psxviewcross-checks several sources (the active list, pool scanning, the thread list, the CSRSS handle table, and others) and prints a True/False matrix. A process that shows False underpslistbut True elsewhere has been hidden on purpose.
In “the analyst”, one line of the pslist output stood out:

The columns are the virtual offset of the _EPROCESS, the name, PID, parent PID, thread and handle counts, session, a WoW64 flag, and the start time. Two details help with reading lists like this:
- Names are cut off at 14 characters (
GoogleCrashHan,SearchIndexer.) because theImageFileNamefield in_EPROCESSis a fixed 15-byte buffer.GoogleCrashHanisGoogleCrashHandler.exe, which Chrome installs. If you need the full path, thedlllistorcmdlineplugins read it from the process environment block. VBoxTray.exeis the VirtualBox guest-additions tray process, so this dump came from a VM. Its parent, PID 1644, isexplorer.exe, which is normal for a tray application.
A Chrome-related process becomes important later. I come back to PID 1196 in Step 6.
Step 3: console history with cmdscan
On Windows 7, the console window for cmd.exe is hosted by conhost.exe. On XP and Server 2003 it is hosted by csrss.exe. The host process keeps a _COMMAND_HISTORY buffer of everything typed at the prompt, the same buffer you scroll through with the up arrow. cmdscan searches the host processes for those structures:
python2 vol.py -f chall.raw --profile=Win7SP1x86_23418 cmdscan
This was the first plugin I ran on blackscreen execution. A black screen strongly suggests a console window, and it turned out to be the whole challenge:

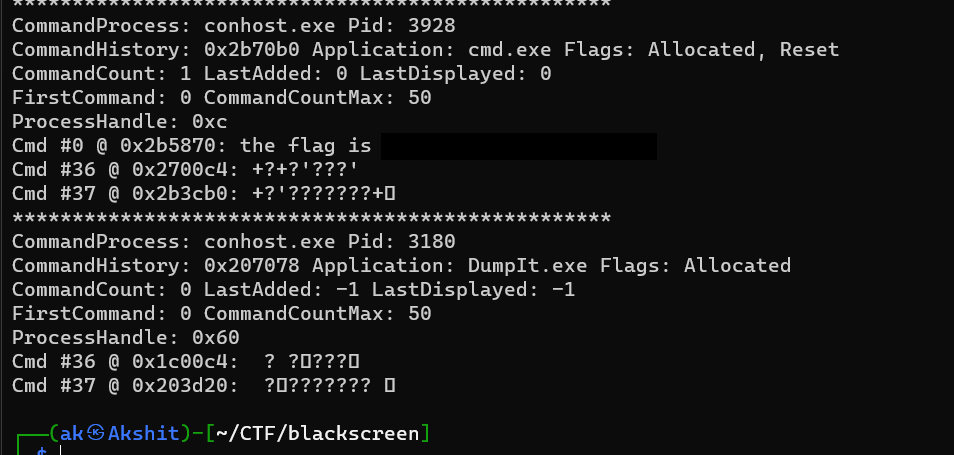
How to read each block:
- CommandProcess / Application: the host (
conhost.exe, PID 3928) and the console application it served (cmd.exe). - CommandCount / CommandCountMax: one command recorded, out of a default 50-entry buffer.
- Cmd #0: the recorded line. Someone typed
the flag is bi0s{...}at the prompt. It isn’t a valid command, butconhostrecords the line beforecmd.exetries to run it. - Cmd #36 and #37: noise.
cmdscanfinds these structures by scanning rather than by following pointers, so slots past the real count can contain leftover bytes. Trust the entries up toCommandCount.
The second block is worth noticing in any real investigation. Its application is DumpIt.exe, a common memory-acquisition tool. You will often find the acquisition tool in its own dump, and seeing it confirms how and when the image was taken.
cmdscan only shows input. Its sibling consoles also reconstructs the console screen buffer, which shows command output as well. It is worth running both whenever a console was involved.
Step 4: browser and file-access history with iehistory
iehistory parses the WinINet cache (index.dat records) in process memory. That covers Internet Explorer history, and also something more useful: Windows Explorer records local file access through the same WinINet history, as file:/// URLs. That makes this plugin a quick way to see which files a user opened.
python2 vol.py -f challenge.raw --profile=Win7SP1x86 iehistory
In recoverytxt, after a first pass with the usual process plugins turned up nothing unusual, iehistory was the output that mattered:
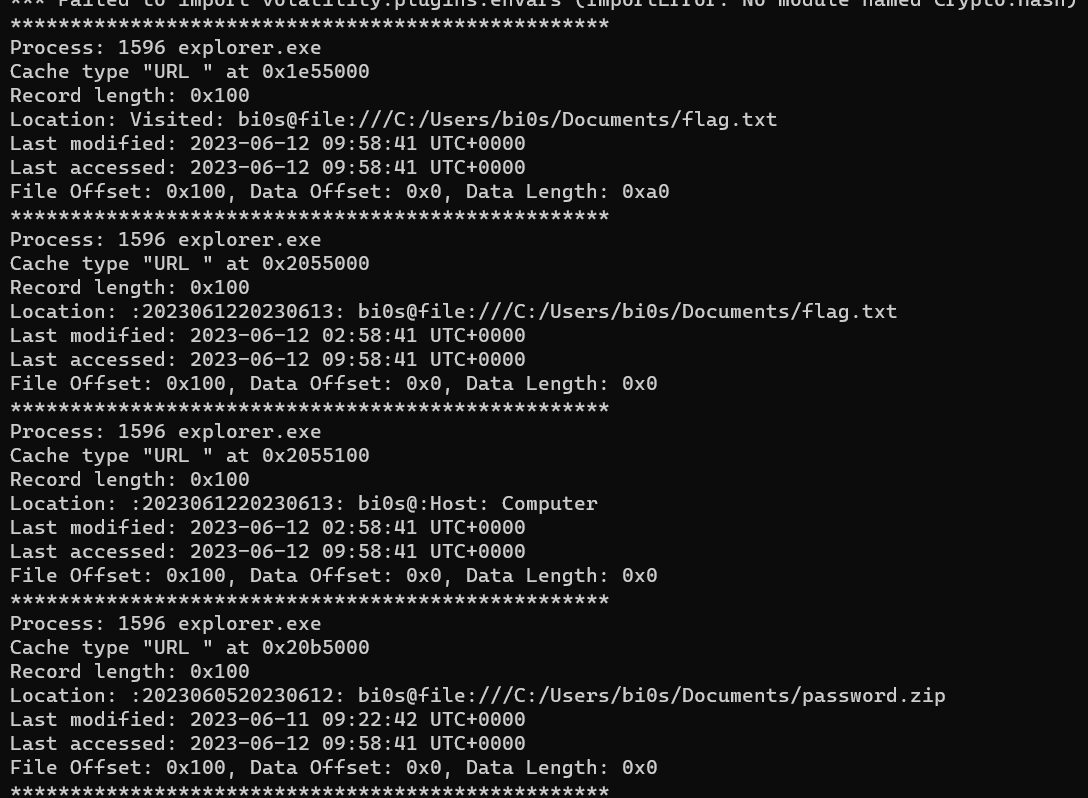
Each record shows:
- Process:
explorer.exe, not a browser. Explorer is the process that opened the local files. - Location:
Visited: bi0s@file:///C:/Users/bi0s/Documents/flag.txtis a record from the main history container. Entries prefixed:2023061220230613:come from a daily history container covering 12 to 13 June 2023, which is why the same file appears more than once. - Last modified / Last accessed: the
password.zipentry was last modified 2023-06-11 09:22:42 UTC, and both files were accessed 2023-06-12 09:58:41 UTC.
So there are two named targets: flag.txt and password.zip, both in the user’s Documents folder. The next step is to get them out of memory.
Note that iehistory only understands WinINet. It does not see Chrome or Firefox history. In “the analyst” the challenge description hinted at internet history, and iehistory came back empty, which is why that trail led to Step 6 instead.
Step 5: recover files with filescan and dumpfiles
Finding file objects
Whenever Windows opens a file, the kernel creates a _FILE_OBJECT. filescan finds them by pool-tag scanning physical memory, so it also catches objects for files that have since been closed. The output is long, so always filter it:
python2 vol.py -f challenge.raw --profile=Win7SP1x86 filescan | grep -i "password.zip"
python2 vol.py -f challenge.raw --profile=Win7SP1x86 filescan | grep -i "flag"
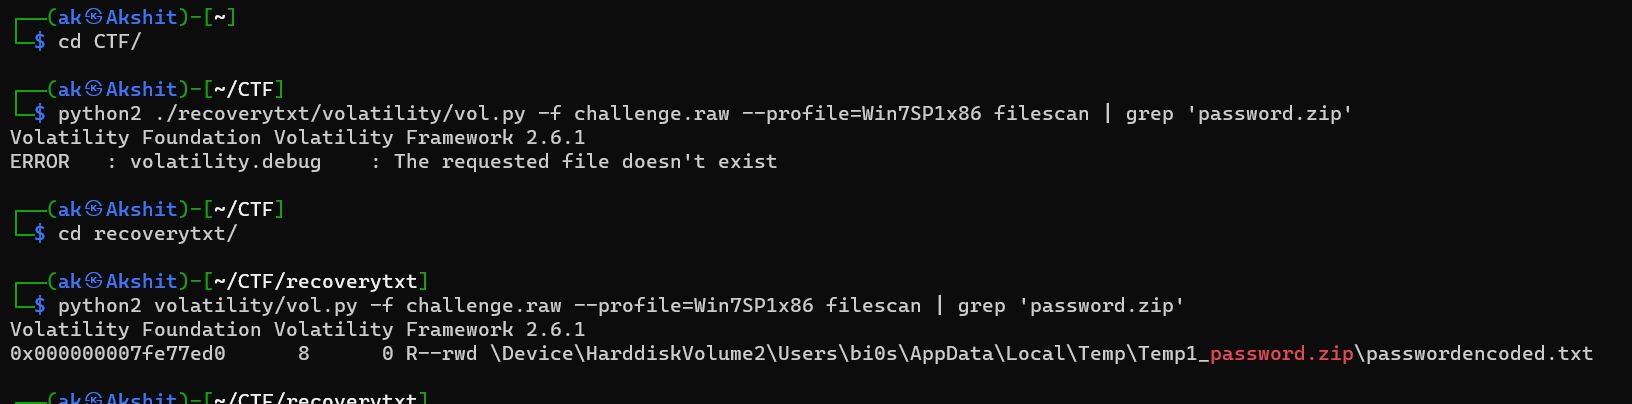
The columns are the physical offset of the _FILE_OBJECT, pointer and handle counts, the access mask (R--rwd means opened for read, with read/write/delete sharing), and the device path. The physical offset in the first column is what the next plugin needs.
The first command in the screenshot fails with “The requested file doesn’t exist”. That is not a forensics result; it is Volatility failing to open the memory image because I ran it from the wrong directory and the relative path to vol.py and the image was off. After cd into the right folder, the same command returns the object.
Dumping the contents
dumpfiles extracts the cached contents of a file object. The -Q option takes the physical offset from filescan:
python2 vol.py -f challenge.raw --profile=Win7SP1x86 \
  dumpfiles -Q 0x000000003e4472a0 --dump-dir ./output
A few things to know about dumpfiles:
- It recovers whatever pages of the file were resident in memory. If the file was fully cached, you get the whole thing; if not, you get the parts that were paged in.
- It writes files named after the object, such as
file.None.0x87658d48.dat(aDataSectionObject) orfile.940.0x871994f0.vacb(a view of the cache). The.datcopy is usually the one you want. - You give it the offset, not the filename, so it is easy to lose track of which output came from which object. When I dumped several at once I had to check each one.
In recoverytxt I dumped the objects and inspected them:
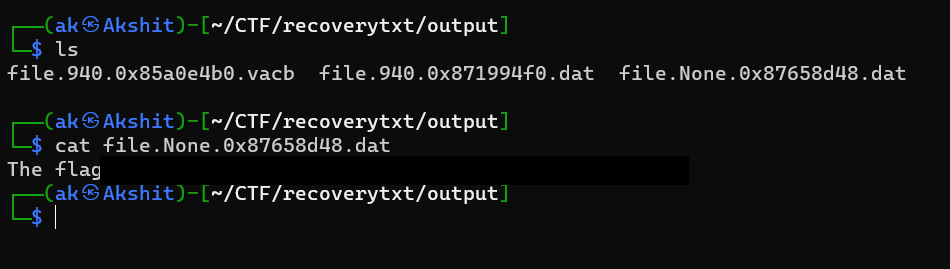
The recovered file reads The flag is <string>=. The trailing = is base64 padding, so this is not the flag itself but a base64-encoded value. Decoding it (I used CyberChef with a single From Base64 operation) produces the real flag:
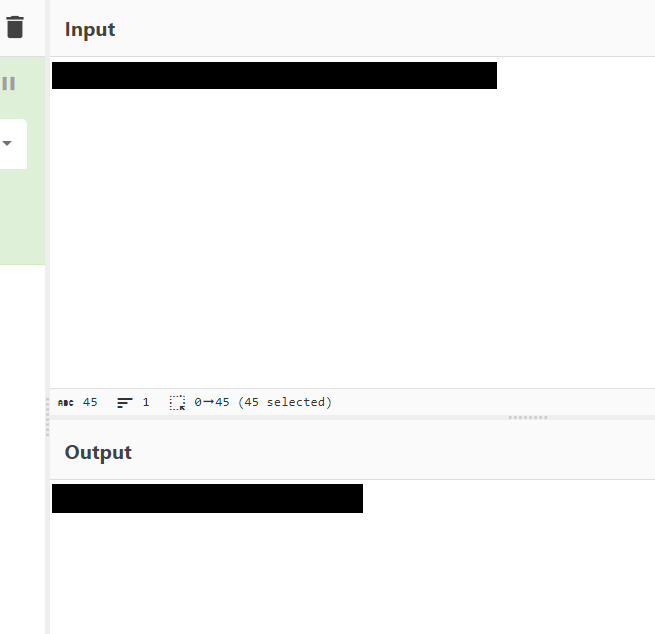
That closes out recoverytxt: iehistory named the files, filescan located them, dumpfiles recovered them, and a base64 decode finished the job.
Step 6: dump a process and run strings
Some evidence isn’t a file at all; it only exists inside a running process’s memory. The plugins for this are procdump, which carves out the executable, and memdump, which writes the full address space of a process to one file. Running strings over a memdump is a blunt but effective way to find URLs, keys, and text a program was holding in memory.
python2 vol.py -f ch4ll.raw --profile=Win7SP1x86 memdump -p 1196 --dump-dir ./dumpdir
The analyst is where this pays off, and it takes several of the earlier steps together.
Recovering and cracking the zip
filescan found the same password.zip / passwordencoded.txt pair as before, plus the zip itself in the user’s Documents folder:
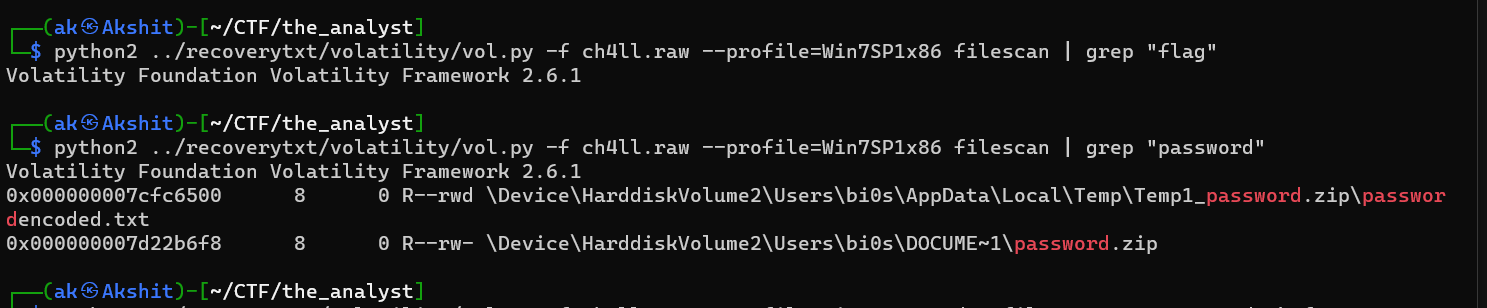
I dumped the zip’s file object with dumpfiles:

The dumped .dat is a zip archive (confirmed with file), so I renamed it and tried to open it, but it was password protected:
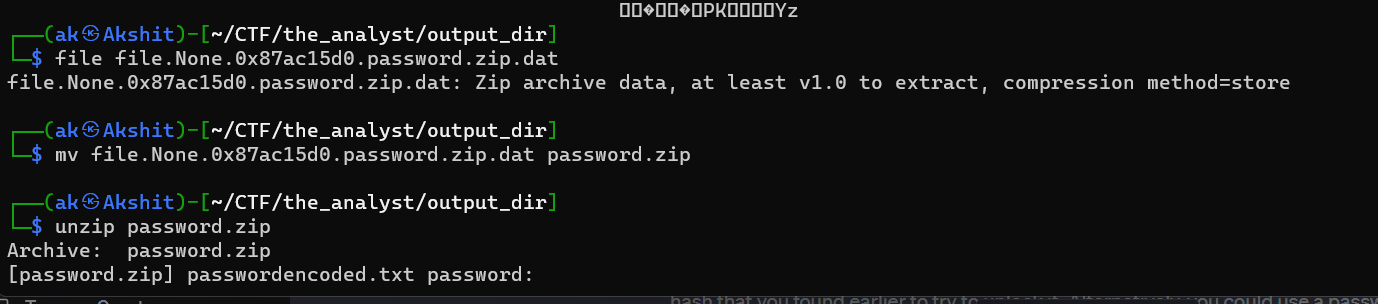
To crack it I used John the Ripper. zip2john turns the archive into a hash John can attack, then john runs through its default wordlist:
zip2john password.zip > hash.txt
john hash.txt
john --show hash.txt
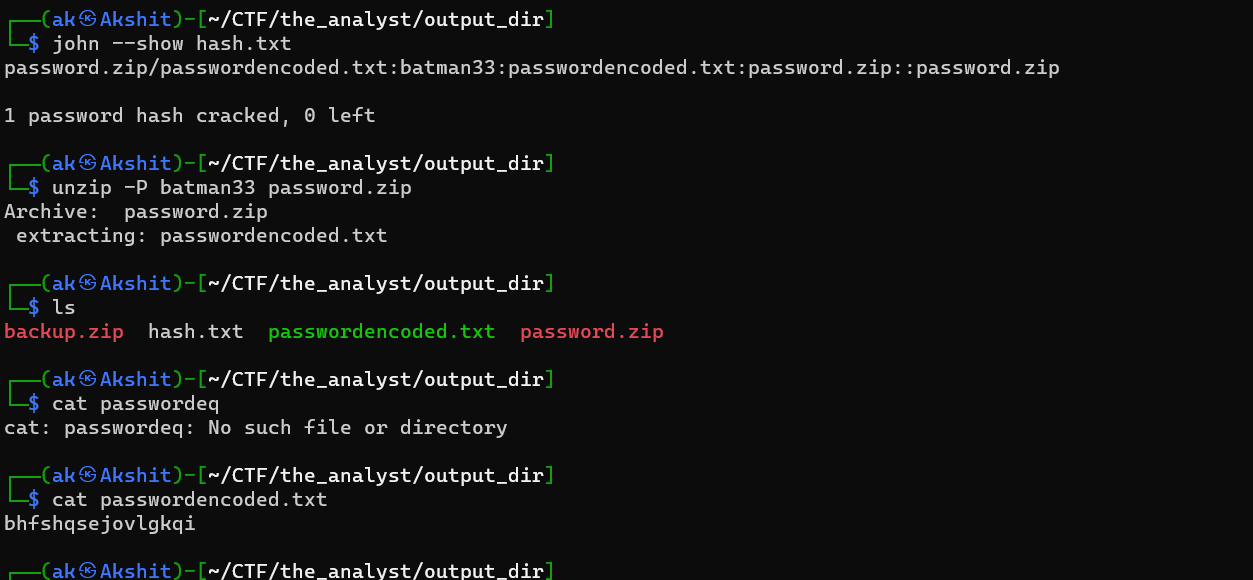
The archive opens with the recovered password, and the file inside holds a 16-character string, bhfshqsejovlgkqi. The name passwordencoded.txt says it is encoded, not plaintext. To decode it I needed a key, and the challenge description hinted at environment variables.
The key in the environment variables
envars lists every process’s environment block. Filtering for the hint word finds a custom variable:
python2 vol.py -f ch4ll.raw --profile=Win7SP1x86 envars | grep -i "key"
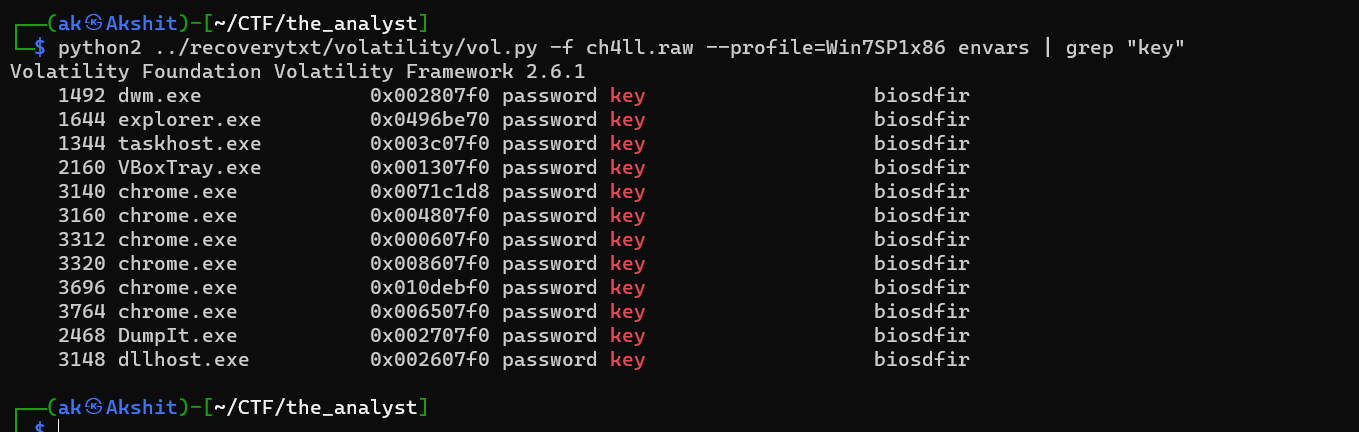
The variable password key holds biosdfir. It appears in every process because child processes inherit their parent’s environment, so a variable set early (here, by the shell or a login script) propagates everywhere. That inheritance is exactly what makes envars useful: a secret set once shows up in many processes.
A later hint said the encoded value and the key go together through a substitution cipher. biosdfir as a repeating keyword over an alphabetic ciphertext is a classic Vigenere setup. I decoded bhfshqsejovlgkqi with the key biosdfir using dCode’s Vigenere decoder:
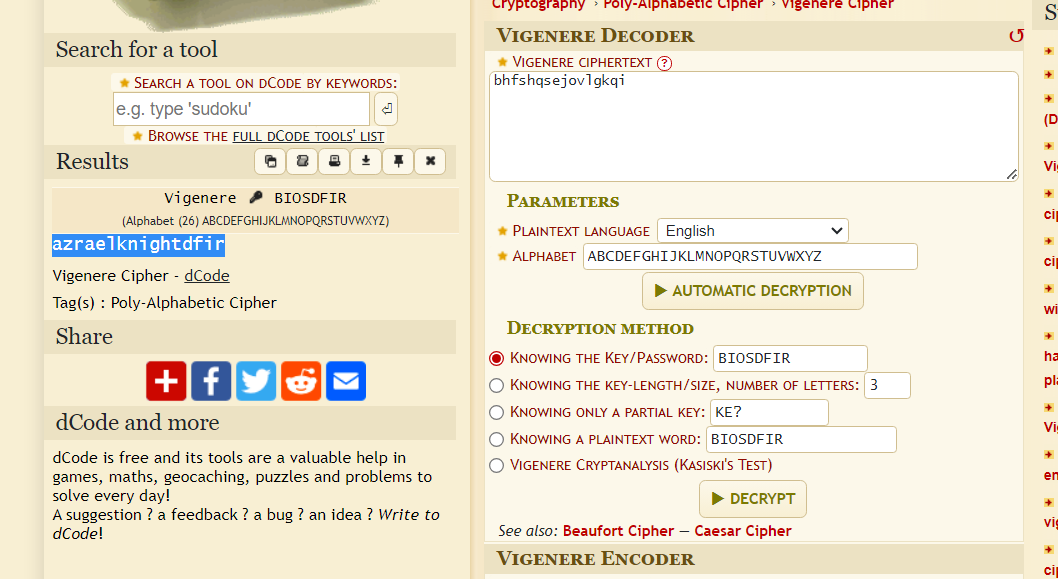
That gives azraelknightdfir. (I confirmed it independently: subtracting the repeating key biosdfir from the ciphertext, letter by letter mod 26, produces the same plaintext.) One caution from doing this: if the “Knowing the key” field gives a wrong-looking result, try the partial-key option too, because some decoders treat key handling slightly differently. Hold on to azraelknightdfir; it unlocks the final piece.
The Chrome crash process and pastebin
The description also pointed at internet history, but iehistory was empty because the browser here was Chrome, which iehistory cannot read. The process list from Step 2 had a Chrome component, GoogleCrashHandler.exe (PID 1196). Its memory is a good place to look for URLs Chrome was handling. I dumped it and grepped the result for strings:
python2 vol.py -f ch4ll.raw --profile=Win7SP1x86 memdump -p 1196 --dump-dir ./dumpdir
strings dumpdir/1196.dmp | grep -i "paste"

Most of the hits are generic pastebin.com references, but one is a specific paste: https://pastebin.com/2FA017n7. Opening it shows a locked paste that asks for a password:

I entered the decoded key, azraelknightdfir, and the paste unlocked to reveal the flag:

So “the analyst” chained five of the techniques above: filescan and dumpfiles to recover a zip, John to crack it, envars to find a cipher key, a Vigenere decode to turn that key into a password, and memdump plus strings to pull a URL out of a Chrome process.
A reusable checklist
The three challenges are different, but the order of operations is the same every time:
imageinfofirst, always. Everything downstream depends on the profile. Note the image timestamp while you are there.- Map the processes with
pslist,pstree,psscan, andpsxview. Look for odd parents, odd names, and anything the active list hides. Remember names are truncated to 14 characters. - Check console history with
cmdscan(input) andconsoles(input plus screen output) whenever a terminal or “black screen” is involved. - Check access history:
iehistoryfor Internet Explorer and, importantly, for local file access via Windows Explorer. It will not see Chrome or Firefox. - Recover files by locating
_FILE_OBJECTs withfilescan, then extracting them withdumpfiles -Q <offset>. Decode or crack what you recover. - Go into a process with
memdumporprocdump, then runstringswhen the evidence lives only in a running program’s memory. - Check the environment with
envars. Inherited variables surface secrets that were set once and propagate everywhere.
Takeaways
- The profile is the foundation. A wrong profile makes every later plugin lie to you. Run
imageinfofirst and let it, orkdbgscan, settle any ambiguity before you trust process or file output. - Scan-based plugins see more than list-based ones.
pslistandiehistoryfollow live structures;psscan,psxview, andfilescanscan raw memory and so recover closed, exited, or hidden artefacts. Reach for the scanning plugins when the obvious ones come up empty. - Memory holds what the disk doesn’t. Console history, inherited environment variables, and a browser’s in-memory URLs are rarely on disk, yet each one was the pivot in a challenge here.
- Recovery is only step one. A dumped file was base64, a recovered zip was password protected, and an environment variable was a cipher key. Volatility gets the artefact out of memory; decoding, cracking, and correlating it is the rest of the work.
Tools: Volatility 2.6.1 (Python 2), John the Ripper (zip2john), CyberChef, dCode. Challenges: “recoverytxt”, “blackscreen execution”, and “the analyst”, DD CTF by team bi0s.